
When asking participants to complete a series of polls or ratings, you typically want to understand why they made a particular rating or choice as well. Asking participants a series of Polls followed by Text questions can become a bit overwhelming when asking a larger number of questions, so ideally you would want to streamline the participant experience as much as possible. In situations like these wouldn't it be great if it could all be done on a single page? In today's blog we'll be looking at the Grid Task, which excels in these exact situations!
- What is the Grid Task?
- What can you do with the Grid Task?
- Grid Task: Data Visualizations
What is the Grid Task?
The Grid Task allows you to configure a matrix of rows and columns where participants make a selection for each row based on the columns provided. You can configure your rows and columns so that each row is a rating (such as a Likert scale), or a selection between discrete groups (such as 'Must Have Items' vs 'Not Important Items'). In addition, the Task can be configured so that participants can make multiple selections per row, or so that they can only select a single row per column, allowing you to create ranking questions. Finally, both the rows and columns use a rich text editor, allowing you to adjust the font and/or color, as well as add photos or embed videos.
These various configuration options can be leveraged to create a wide variety of question types that are capable of collecting both Quantitative and Qualitative data from your participants on a single page.
The Grid Task also fits all screens, regardless of how complicated you make your setup, allowing your participants the freedom to respond on whichever device they are most comfortable with. Some specific examples and use cases are described in more detail below.
What can you do with the Grid Task?
Mini Survey
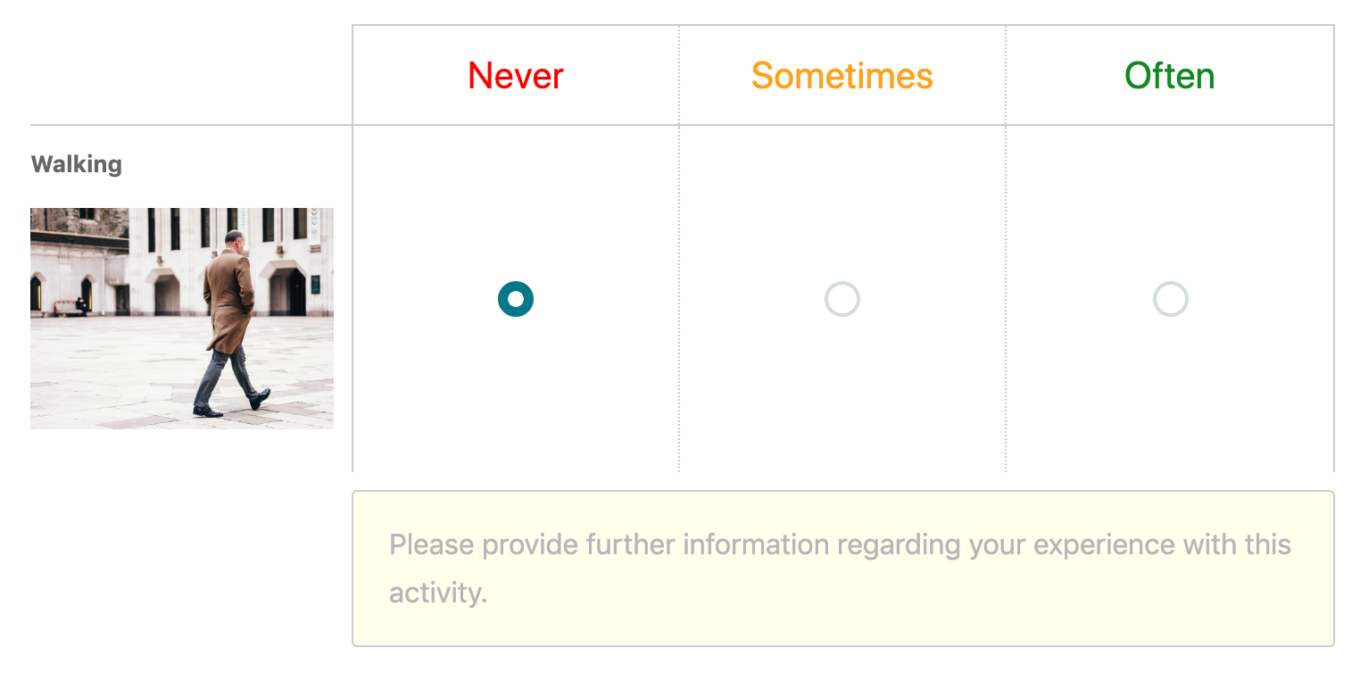
The Grid Task is particularly useful when you want to ask participants a series of ratings (that use the same scale) and you want participants to provide an explanation for each rating. In this instance, your rating scale would make up your columns and your items to rate would make up your rows. Once a participant makes a rating, a text box will pop out below, allowing the participant to explain why they rated that particular item the way they did.
Sorting Exercises
While Recollective has a dedicated Sort & Rank Task, sometimes you may want participants to provide an explanation of why they sorted each item into the group they have chosen. In these instances, a Grid Task is your best bet. The setup is quite similar to the Mini-Survey, only this time your columns are made up of distinct groups as opposed to points on a scale. The Grid Task can also be configured so that the comment box only appears if a specific group is selected, allowing you to narrow in on a specific group so that you don't overwhelm your participants with a large amount of follow-ups. Participants can even be permitted to add their own items, which can help to identify items you may not have even thought of in the first place!
Ranking with comments for each item rank
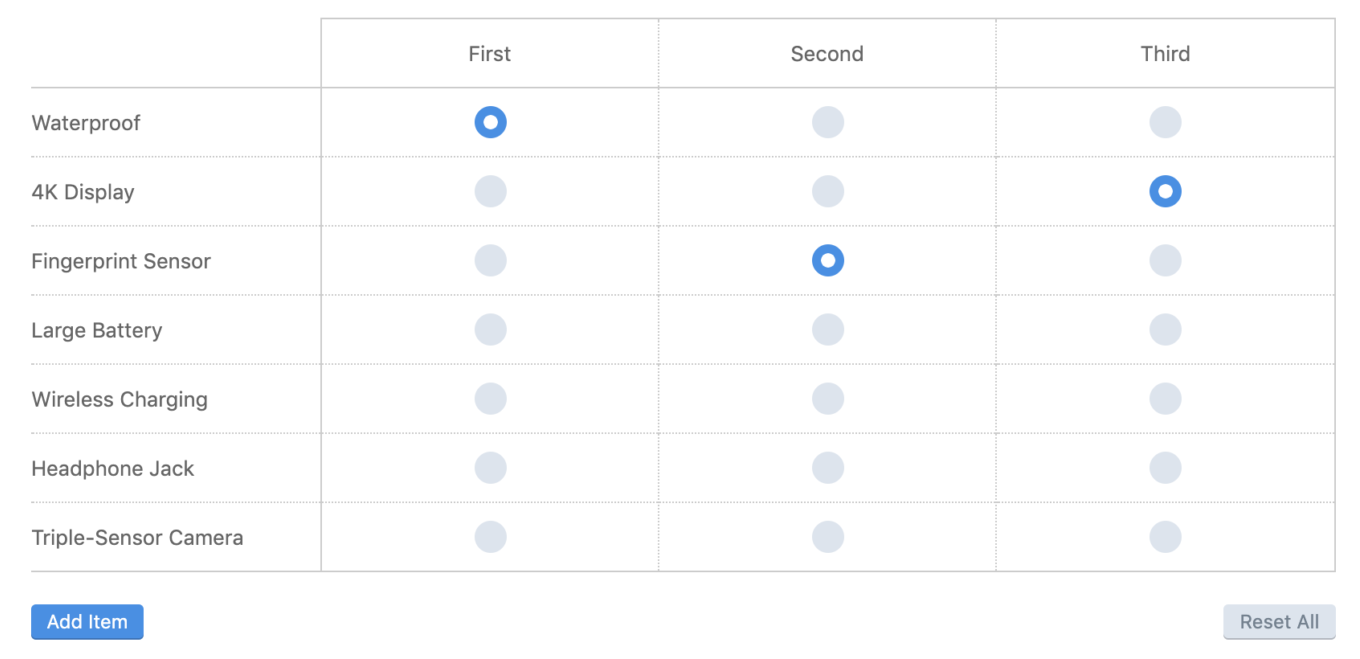
As mentioned earlier, the Grid Task can be configured so that only one selection can be made per column, allowing you to create a ranking question that allows participants to explain why they ranked each item as they did.
Grid Task: Data Visualizations
The Grid Task produces a Distribution Bar Chart that displays each row as an individual chart element with stacked colored bars representing the columns. In the example below, Durability, Price, Aesthetics, etc., are the rows, while 1st Factor, 2nd Factor, & 3rd Factor are the columns. The percentages (or counts) indicate the number of times each column was selected per row item (e.g. 100% of participants selected a column for Durability / Quality, with 66.7% selecting 1st Factor and 33.3% selecting 3rd Factor).
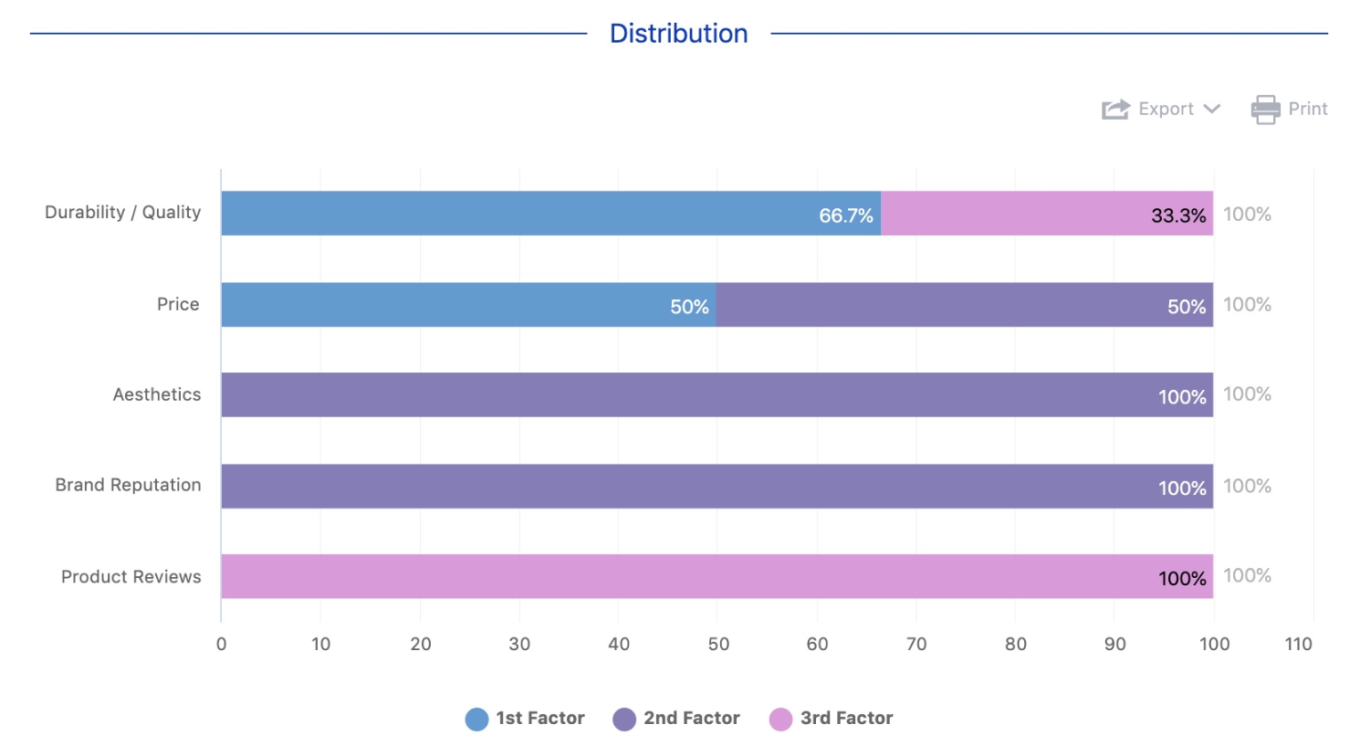
Recollectives chart customization options can be used to change the chart format (horizontal vs vertical), to switch between counts and percentages, as well as to group or hide items. You can configure the chart however you see fit and then export it once you're ready. As with all charts within Recollective, you can export the raw data as well!
The examples above are only a small subset of what is possible with the Grid Task. Each of the many configuration options can be leveraged to create a wide variety of question types that can help to streamline the participant experience, as well as make your study more fun and engaging. The Grid Task is a great combination of Qual and Quant and should always be considered when designing your research within Recollective!


.svg)