
Often one of the first things participants see when they login to a Recollective study is the stats bar on the summary page.
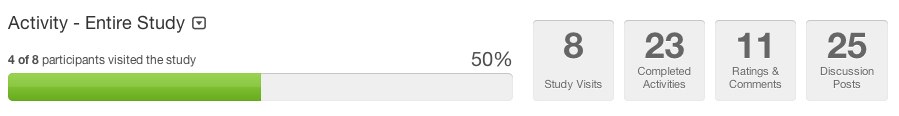
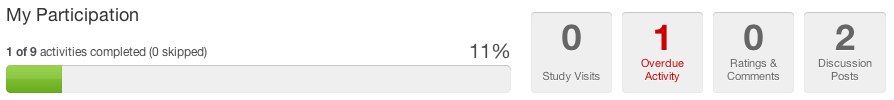
To admins this bar gives a high level look at the status of the study. You can see what percentage of your participants have logged in, how many total study visits there have been, the number of completed activities, comments and ratings, and the number of discussion posts. To participants this bar tells them about their own activity in the study. They can see how many activities they’ve completed, how many times they’ve logged in, the number of ratings and comments they’ve made and how many times they’ve posted in discussions. If they have any overdue activities we’ve highlighted this section in red in the hopes of alarming them into completing them!
Feedback indicates that both admins and participants love this feature. It helps admins to take the pulse of the study and it gamifies the study for participants. It’s amazing how many participants strive to get their bar up to 100%! Despite it’s popularity with admins and participants alike, in my opinion this feature is underused. The default is to display stats for the entire duration of the study, however this can be updated to display stats for preset date ranges (eg. past 7 days, past 30 days, this month) or if this doesn’t do it for you, you can create a custom start date to begin the stats on.
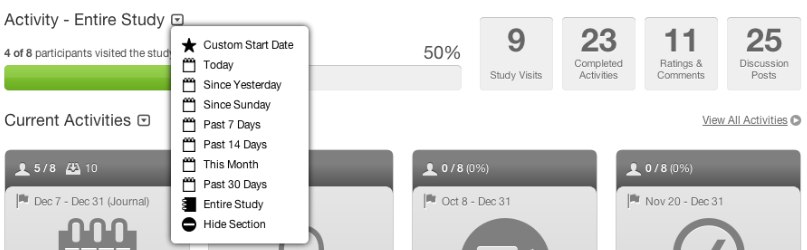
These options are particularly useful for longer duration studies, however they can be applied to shorter projects as well. Since we know participants respond well to the stats bar, it could, for example, be reset every week or even every day. This will engage your participants as they strive to reach 100% completion each time it is reset. As a best practice, and to avoid an influx of support emails, I recommend letting participants know when and how often the bar will be reset. Have you had enough of summary stats yet? I didn’t think so. Here’s a couple more stats bar tricks for you. The Disappearing Stats Bar

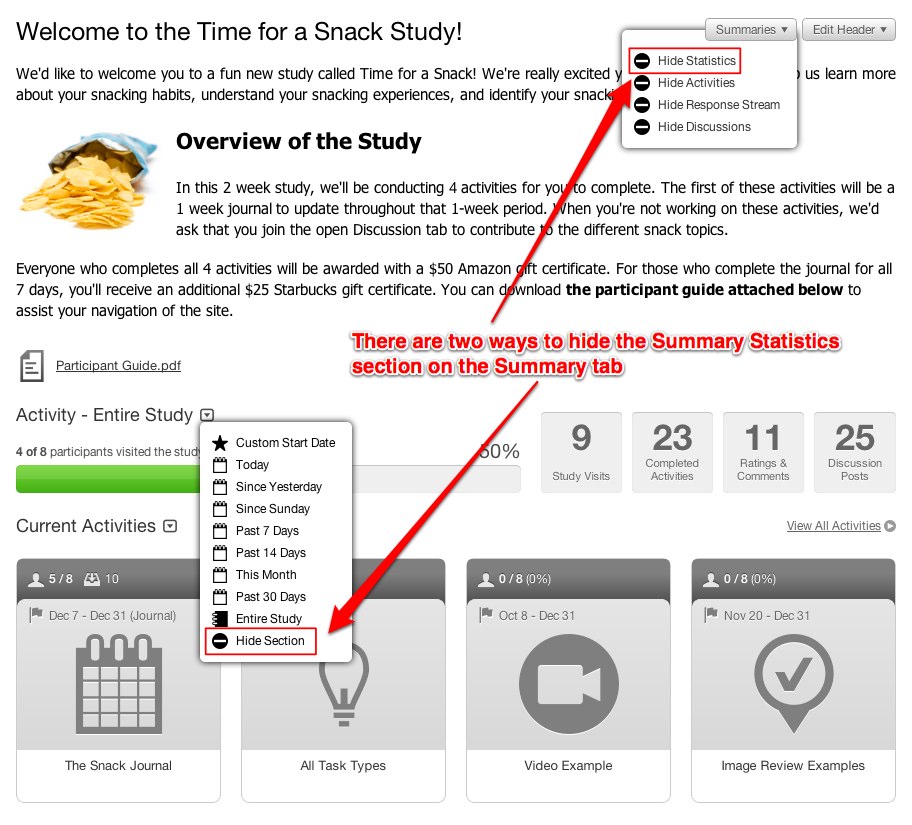
Do you love the stats bar but are afraid it may be distracting, confusing or create unnecessary concerns for your clients? We completely understand and have built in a permission to hide it from all client accounts assigned to the study. To make this change edit the study settings in the side panel and make sure the View summary tab statistics option is unchecked. Now that it’s hidden from your clients, the next inevitable question is: what about the participants? Don’t worry, we’ve covered this as well! If you’d like to hide it from your participants there are two easy ways to do so. The first is by selecting the Summaries button in the right corner of the summary tab and choosing the Hide Statistics option. The second is by selecting the action menu next to the summary statistics section header and choosing the Hide Section option.
Both of these options will hide the summary stats from your participants, your clients (if they’ve been given permission to view them) and even from you. If you’d like to bring them back follow the same instructions, but select either the Show Statistics or Show Section option in these dropdown menus. Although every other section on the summary tab (summary header, current activities, recent responses and topics for discussion) will behave in the same manner, there is one difference with statistics when they are turned back on.
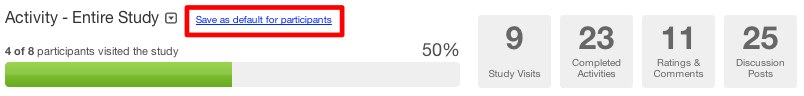
Once re-enabled, there is a link next to the section header that will save this option for your participants. This means if you’ve hidden the stats from your participants you are able to temporarily turn them on so you can check the pulse of the study, but be confident that participants won’t notice this momentary change to their summary page as well. Clicking the Save as default for participants link will enable the stats bar on your participants’ summary pages. If you do not click that link then whenever your page is next refreshed the stats will disappear. Did we miss anything with the stats bar? Can you see any areas where it can be improved? Add a comment to let us know what you think.


.svg)