
Recollective released another major update and it includes several important features that ensure Recollective remains the best online marketing research platform. This post covers in greater detail the new Grid task type.
Introduction
Recollective is primarily a platform for qualitative research but it includes an activity and task-based structure that can simulate the flow of a traditional survey and thus it’s ideal for hybrid studies. In addition to the quantitative task types it already possesses, Recollective now includes a beautiful and versatile Grid Task Type (also known as a matrix question).
A grid task is a series of columns that can be selected for any number of rows you wish to define. It’s effectively a table filled with checkboxes or radio-buttons and can be used in many different ways such as rating, categorizing and ranking any list of items, features, ideas, statements or concepts. The task remains qualitative in that it provides the ability to collect commentary for each row-level response and you can give participants the opportunity to add their own rows. To help with the monotony of a big table, rows and columns can be richly formatted and they can even include inline images.
Many flexible setup options are included such as the ability for row and column randomization, column weighting, forced ranking and more. And finally, the summary stream and charts provide a rapid overview of all completed responses with the ability to drill down, excerpt and export on everything you discover.
Grid Task Setup
Setting up a Grid in Recollective is not unlike setting up a Poll task. Once you’ve written the instructions, you start by defining columns and related options before moving onto the rows. Column Setup
- Supports simple labels or richly formatted text
- Easily add images via drag-and-drop (e.g. category icons or mood emoji)
- Option to define a numeric weighting for each column
- Drag-and-drop reordering of columns
- Column randomization with the option to keep the last column fixed (e.g. useful if the last column is “Not Applicable”)
- Option to allow multiple columns to be selected per row with the ability to set a min/max limit on those selections
- Option to only allow a column to be selected once (i.e. forced ranking)

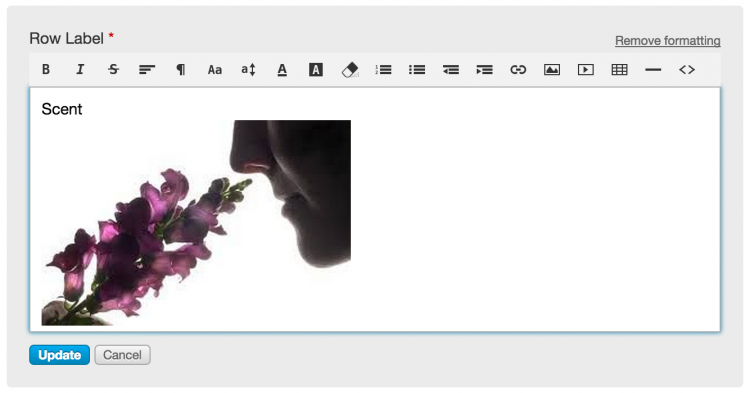
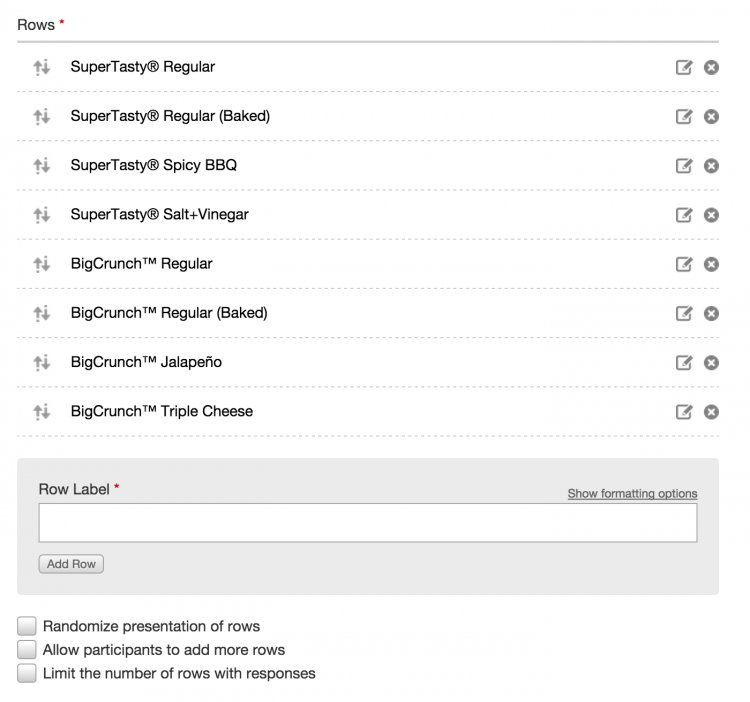
Row Setup
- Row labels also support rich formatting, inline images and drag-and-drop reordering
- Option to allow participants to add their own rows with the ability to enforce a limit on extra rows (minimum and maximum)
- Every row needs a response from participants unless a limit is set (e.g. “Only rate the 3 to 5 of the most important product features.”)
Commentary Setup Two types of comments can be collected during a Grid task response:
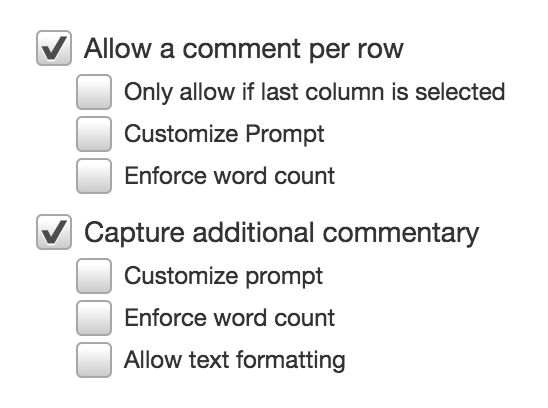
- Option to capture a comment for each row with a response. You can even define a custom prompt (e.g. “Why did you select this category?”) and enforce word limits.
- Ability to capture an overall comment for the response as seen in other task types
Incentives Setup
- If “Incentives” has been enabled for the study, the option appears to override the default point value for a Grid task completion (default is 50 points)

Task Completion
Grid questions are great for participants in that they’re fairly 'dense'. A lot of information can be collected with minimal effort. The downside is that large tables can be intimidating and their physical size can create usability issues if the table doesn’t fit well on someone’s display or mobile device. We’ve worked hard to keep the benefits and minimize the limitations.
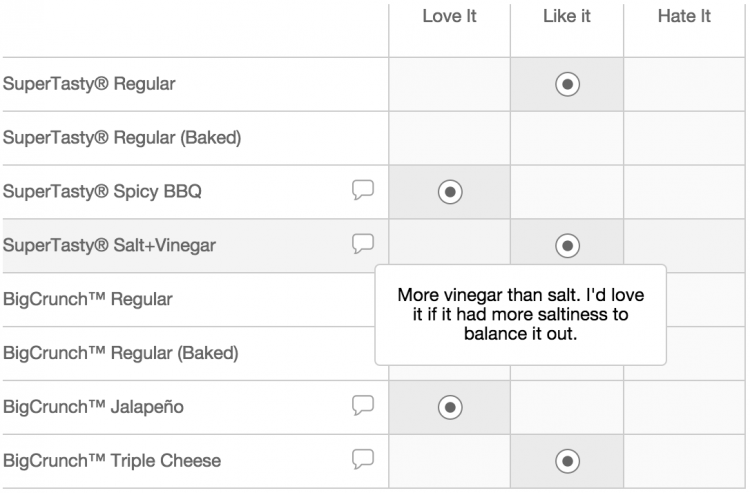
Here are some highlights with regard to the participant interface:
- Visually clean layout improves legibility
- Tooltips on each cell confirm context of each radio-button
- Row and column shading helps the user track their location in the table
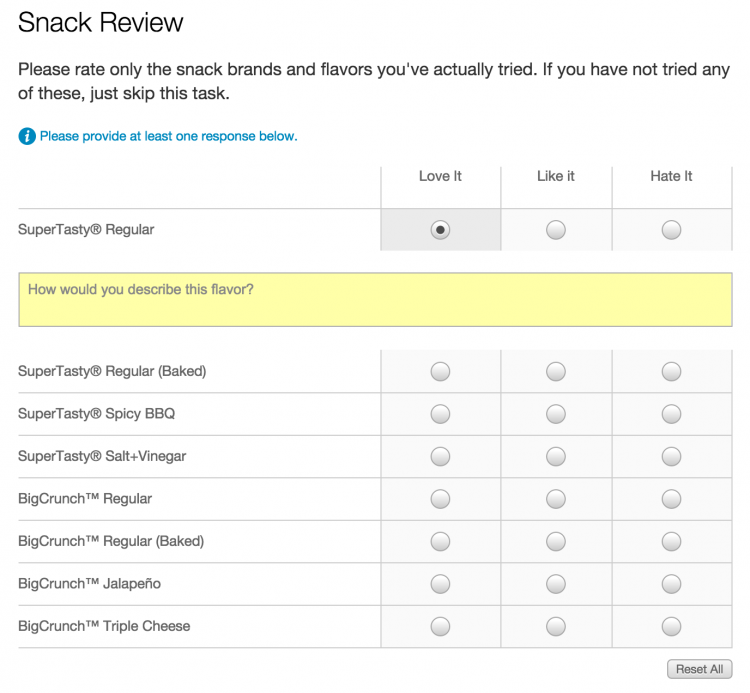
- Interactive prompts ensure they meet limits defined like column selection limits, row-level commentary requirements and limits on extra rows
- Horizontal scrolling aids appear to highlight any unseen columns
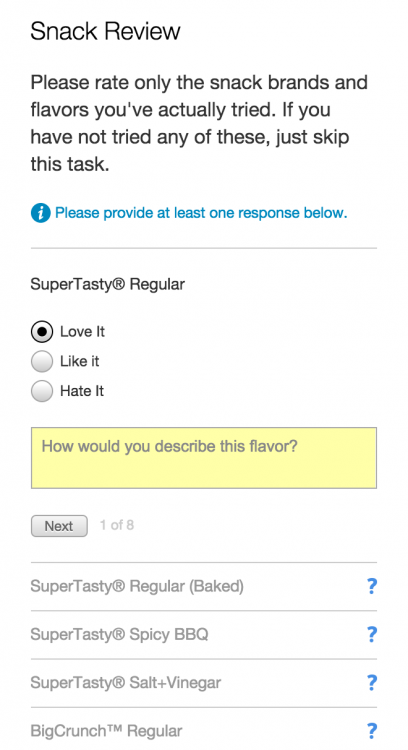
- A mobile-optimized version for small screen prompts participants for responses row-by-row rather than attempting to display a large table on a tiny screen (shown below)
- Partial responses are automatically saved every 15 seconds and lost responses are instantly recovered
- Ability to save a grid response in a draft state and return to it later
- Completed responses appear in the Action Log along with any points awarded for the task completion
Stream and Overviews
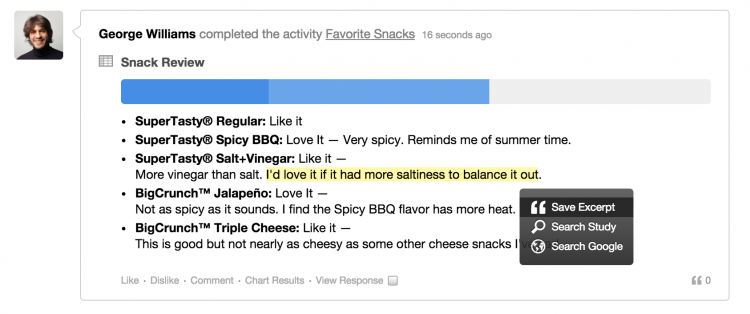
Once an activity response has been completed, Grid tasks are instantly summarized in the response stream, word cloud and chart overviews. Despite the quantitative nature of the task, the response stream entries remain visual and easy to read with the goal of promoting social interaction via comments and ratings.

- Consistent use of chart colours for columns ensures stream entries can be compared and they act as a “heatmap” for the responses (e.g. the left-hand columns are darker than the right-hand columns)
- Stream entries link to detailed response pages and summary charts
- Entries include any row-level comments followed by any overall commentary provided by the participant
- Excerpting can be done directly in the stream to codify any comments made
Charts and Data Exporting
Responses collected from each Grid task are given their own chart in the “Charts” overview. Each chart snippet leads to a detailed chart overview page like the one shown below.
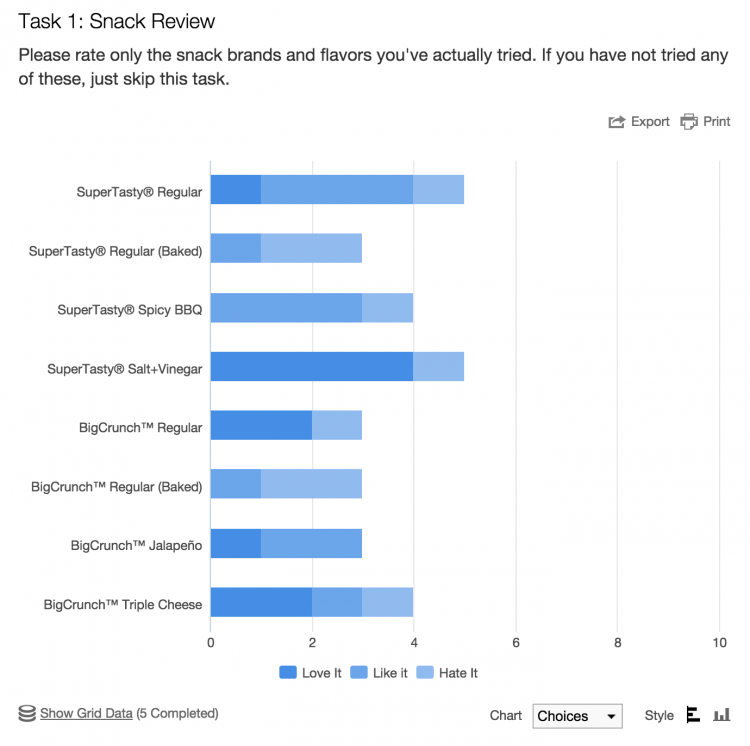
- Columns can be selected in the legend to hide them from the chart
- Orientation of the chart can be changed from vertical to horizontal
- Average weighting can be charted in addition to column distribution if weightings were defined with each column
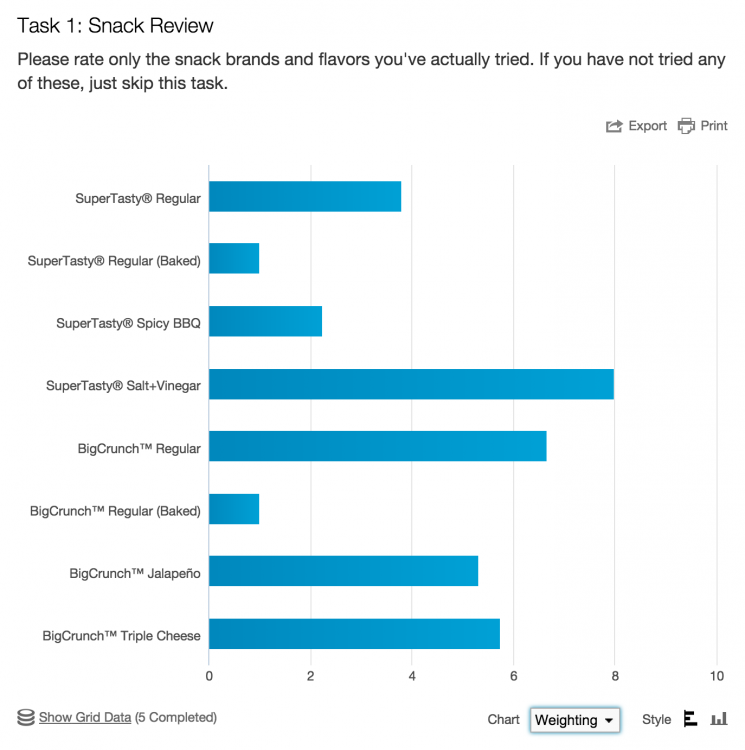
- As usual, charts can be exported to PNG, JPEG, PDF and SVG
- Summary and response data tables appear below the chart and are fully exportable
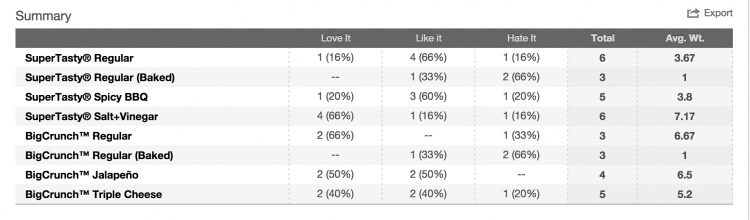
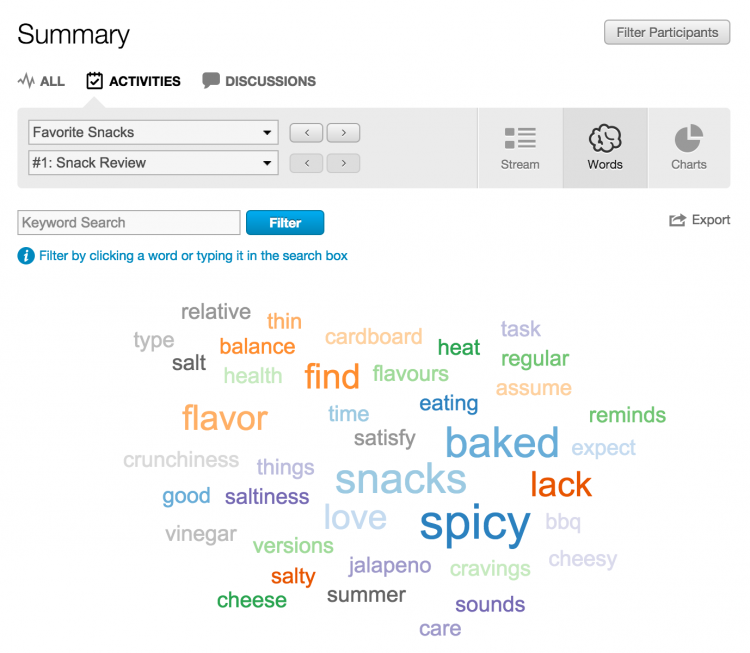
As you'd expect, Grid responses are also included in transcripts (HTML, Excel and CSV). Custom row labels, row-level comments and overall commentary also appear in the Words overview and can be quickly searched.
We hope you will enjoy this new task type and are looking forward to our customers' creative uses of this new capability. We welcome your feedback so please don't hesitate to reach out to us.


.svg)